Count the roofs the interconnection queue never saw.
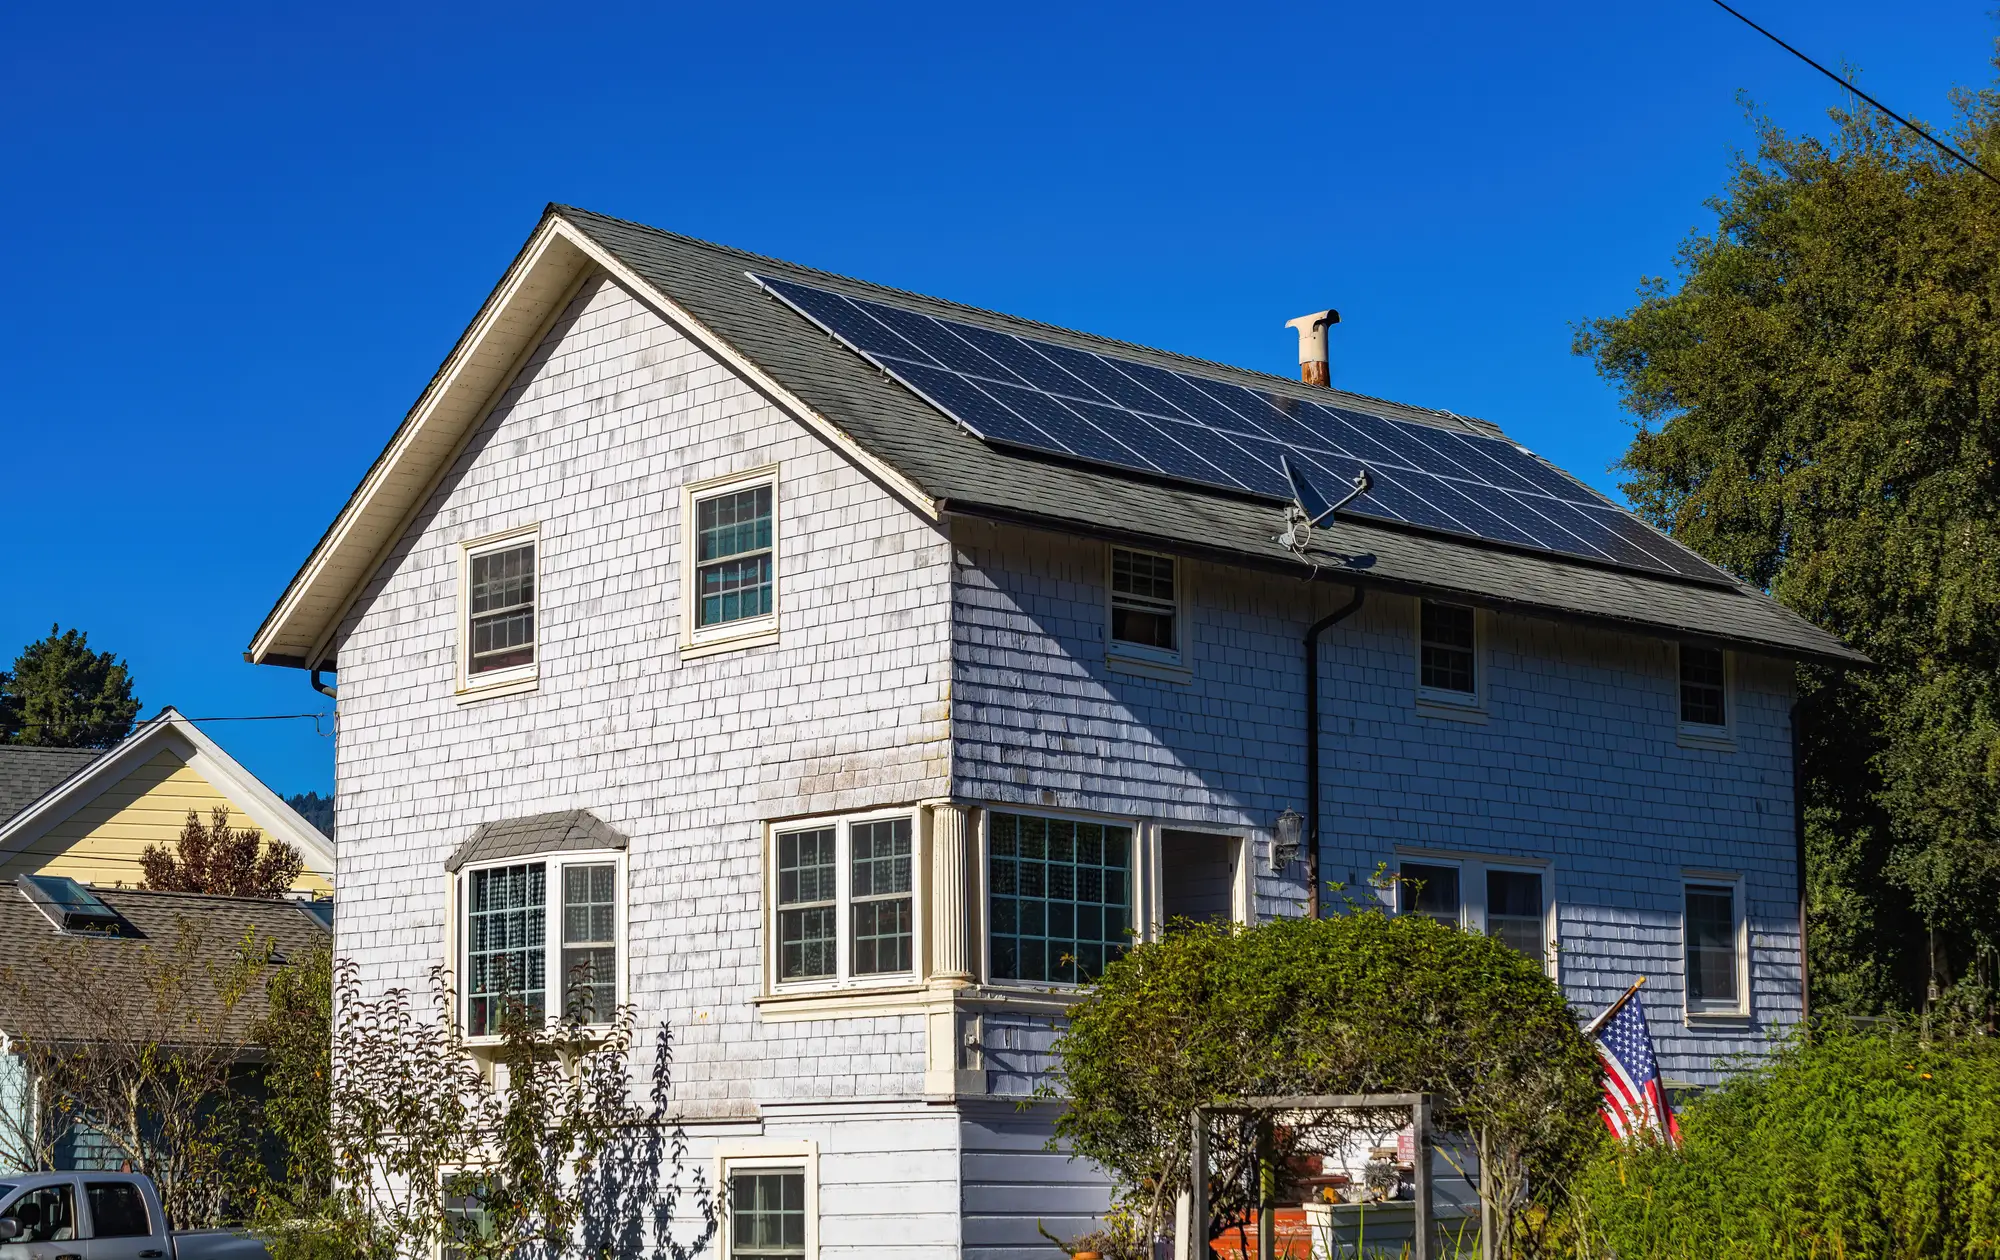
Rooftop Solar Potential splits the roofs in your feeder area into planes, scores each plane for solar viability, then re-checks the same roofs every year to flag the ones that went from bare to panelled. VHR imagery, delivered as a map layer.
- GSD
- ≤0.5 mVHR
- Cadence
- Annualpass
- Platform
- VHRsatellite / aerial
- Spectral
- RGB
What the queue shows and what is on the roof
The job today
You build the DER forecast from the interconnection records. Applications, approved systems, the queue. Every one of them tells you what someone filed. A system that went up without an application reaching you isn't in there, and none of the records tell you how much good roof a feeder still has left to give.
So you fill the gap by hand. Someone pulls building permits from the county or the city, one jurisdiction at a time, and the permit file never lines up with your feeder boundaries. Or an engineer drives the circuit and counts panels from the street, which sees the front slope of the houses facing the road and misses the rest. Both of those take staff time you would rather spend on the load studies, and neither gets repeated next cycle in the same way.
What goes into the forecast is registered systems plus an adjustment for the rest. That adjustment is a judgment call, and it carries into the hosting capacity numbers and the capital plan.
An annual imagery pass reads the roofs themselves. It scores the planes of each roof for what they could carry, and it flags which ones carry panels now. It runs on your feeder areas, and it runs again next year on the same roofs.
Limit
Annual cadence
One pass a year. The flag is as current as the latest clear pass over that area, so a system installed after the pass shows up on the next one.
What comes back
What you get
Roof-plane polygons
Polygons with azimuth and tilt
Each roof outlined as its planes, each plane carrying a compass azimuth and a tilt. This is the layer the other three attach to. It joins to your feeder areas in GIS.
Shading-loss score
Score per plane
How much sun each plane loses to trees, neighbouring buildings and its own roof features, as a score you can sort and filter on.
Usable roof area
Area per building and per feeder
Plane area left after setbacks, hips and valleys are taken out and badly facing or badly shaded planes are dropped. It comes per building and totalled by feeder area. Converting area to kW is your call, since you have your own assumptions.
Adoption change flag
Change list, bare to panelled
On each annual pass, the roofs that read bare last time and panelled now, with the array footprint, plus a year-over-year count by feeder. The flag shows presence on the roof. It is not a filing, an approval or an energised system.
Limit
Resolution floor
At 0.5 m a pixel is about 20 inches across. Roof plane outlines and gross shading show up. Shingle condition, flashing and individual panels do not. We see the array footprint and nothing finer.
Limit
Tree canopy and complicated roofs
Roofs under heavy tree canopy are harder to read. Heavily dormered or mansard roofs get coarser plane splits, and flat roofs with equipment on them get the same.
Limit
Presence, not output
We flag panels on a roof. We do not read wattage, make, inverter or what the system produces, and we do not know if it is connected.
How it works
Draw the area
Send the feeder areas, the service territory or the portfolio boundary as polygons.
We pull the imagery
We pick the latest clear VHR pass over the area, satellite or aerial, at 0.5 m or finer.
Limit
Clear sky
Optical imagery needs a clear pass, and cloud can push the pass for an area later.
Roofs split into planes
Building roofs in the area are cut into planes, and each plane is scored for azimuth, tilt and shading loss.
Layer and change list
You get the map layer, and from the second pass on, the change list of newly panelled roofs and the count per feeder.
Where it fits in your workflow
Beside the interconnection records
Use the adoption count as a check on the registered systems in each feeder area, and the usable roof area as the ceiling for how much more can go on. The queue still tells you what has been filed and approved. The layer tells you what the imagery shows built and what the roofs could carry. Your forecast, your hosting capacity analysis and your load studies stay yours.
Limits
Annual cadence
One pass a year. The flag is as current as the latest clear pass over that area, so a system installed after the pass shows up on the next one.
Clear sky
Optical imagery needs a clear pass, and cloud can push the pass for an area later.
Resolution floor
At 0.5 m a pixel is about 20 inches across. Roof plane outlines and gross shading show up. Shingle condition, flashing and individual panels do not. We see the array footprint and nothing finer.
Tree canopy and complicated roofs
Roofs under heavy tree canopy are harder to read. Heavily dormered or mansard roofs get coarser plane splits, and flat roofs with equipment on them get the same.
Presence, not output
We flag panels on a roof. We do not read wattage, make, inverter or what the system produces, and we do not know if it is connected.
Who it's for
For
- Distribution planners and DER forecasters building feeder-level forecasts
- System planning teams checking registered PV against what is on the roofs
- GIS groups who will join the layer to the feeder model
Not for
- Quoting or sizing a system for one homeowner
- Reading panel output, wattage or equipment
- Permit or interconnection status
- Weekly or real-time tracking of installations
Questions before a project
FAQ
Does this replace our interconnection data?
No. The queue and the registry tell you what was filed and approved. This tells you what the imagery shows on the roofs, and you reconcile the two.
How do we check it against our own records?
Pick a feeder area where you know the registered systems well. Send us that boundary and compare the roofs we flag as panelled with your records.
What do we send, and what do we get back?
Feeder areas, territory or portfolio boundaries. You get the roof-plane layer, the shading scores, the usable area, and the adoption change list.
Will it open against our feeder model?
It comes as a GIS layer you can join to feeder areas. We don't write into your planning systems.
Can you tell panel size or output?
No. Optical imagery shows the array footprint. Capacity is something you work out from area with your own assumptions.
How current is “panelled”?
As current as the latest annual pass over that area.
What does cloud do to a pass?
Optical imagery needs a clear pass. Cloud can delay an area, and we say so in the delivery.
Who owns the imagery and the results?
Ownership and licence terms are agreed in writing when the project starts. If your legal team needs them sooner, ask.
How is it priced?
It depends on the size of the area and which imagery is used. Tell us your feeder areas and we'll scope it.
See your feeder areas' roof stock.
Send us a feeder boundary and we'll tell you what the imagery can show for it.
Start a project